


StockTouch will change the way we understand stocks and companies. Its groundbreaking interface brings the power of data visualization and financial information together. Seamlessly watch the market as it unfolds and quickly dive into data to uncover insights and trends on companies and sectors. Touch anywhere, zoom in and out, monitor price and volume, and study historical information. Fast loading data, elegant design, radiant colors and fluid navigation. Immersive and sublimely intelligent.
MacRevise
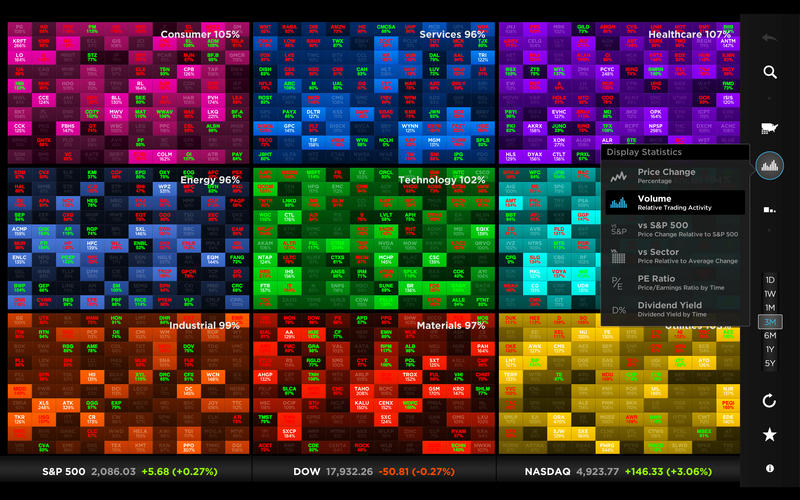
One interface, 9 sectors, 5,000+ companies, 40,000 charts, 50,000 news stories and 150,000 tiles of heat. StockTouch displays heat maps for both the top 900 US and 900 Global companies in each sector by market capitalization. Create custom personal WatchMaps of up to 9 groups and 900 symbols, synced through iCloud and iCloud Drive. Custom WatchMaps can be created, imported and shared via email as CSV text files of symbols. PE Ratio & Dividend Yield heat map views and sorting arrangements. Stock price data updated in real-time throughout the trading day, 9:30AM to 4PM ET. Exceedingly fast performance.
* Real-time: dynamic heat maps, stock quotes, and user-created WatchMaps
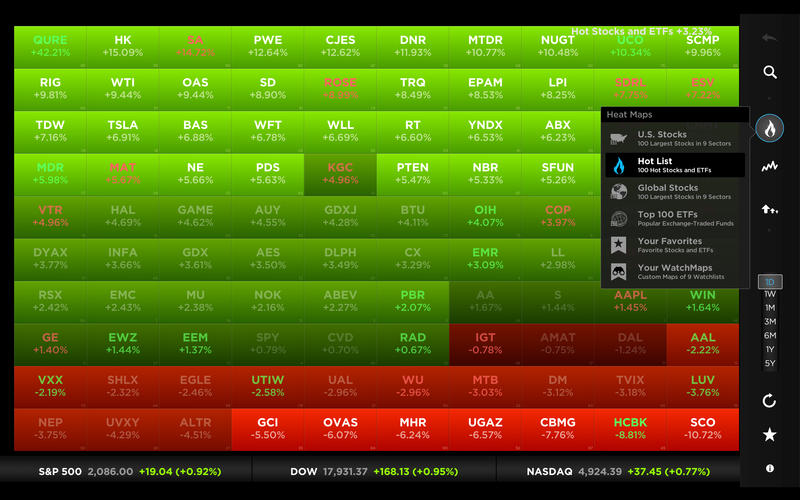
* Hot Stocks dynamic intraday heat map: 100 hottest price and volume movers
* Stunning Live Map Animation display mode preference shows real-time up/down price changes in parallel every few seconds across heat maps during trading hours
* Live dynamic heat maps and custom WatchMaps during trading hours
* WatchMaps: Create and import your own custom 9-sector heat maps using .CSV files to track industries, sample portfolio and investment themes.
StockTouch is part of a new breed of high performance visual business information apps.